Break-even is crucial for the business.
To break-even means to make ZERO profit. A break-even charts shows how much output needs to be sold to make ZERO profit.
This is useful because if the business sells more than this, it must be making a profit.
Here is simple example,
• Drawing a break-even chart
(If you not sure what FC,VC means please check Types of Expense)
FC = £5000 per year, VC = £3 per unit of output,
Price = £8 per unit sold, maximum output is 2000 units per year.
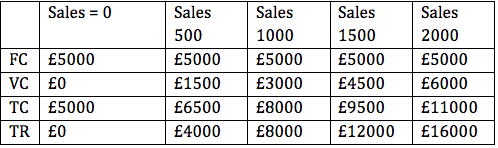
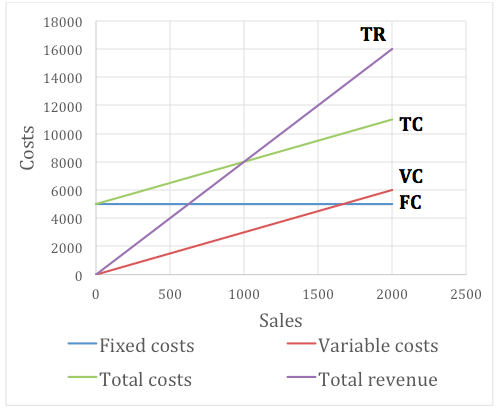
The “ break-even point ” is where TR = TC which is 1000 units in this case.
Company must sell 1000 units to avoid making a loss.
Below ‘break-even’ a loss is made and above ‘break-even’ a profit is made.
Maximum profit of £5000 is at maximum output. (£16000 - £11000 = £5000 profit per year)
Company must sell 1000 units to avoid making a loss.
Below ‘break-even’ a loss is made and above ‘break-even’ a profit is made.
Maximum profit of £5000 is at maximum output. (£16000 - £11000 = £5000 profit per year)
Advantages and limitations of break-even charts.
Advantages:
Limitations:
When completing a break-even chart, the easiest way is to fill in the values for two levels of output, zero and the maximum output.
Advantages:
- Managers can read off the graph expected profit or loss at each output level.
- The impact of changes to prices or reduction in costs on profit level can be seen.
Limitations:
- They assume costs and revenue are straight lines – but a firm may get a discount for a bulk order (or have to give discount for a customer’s bulk order)
- They assume that all goods produced will be sold. This may not always be true.
- Not all costs can be conveniently classified into fixed or variable. The existence of semi-variable costs make it much more complicated.
When completing a break-even chart, the easiest way is to fill in the values for two levels of output, zero and the maximum output.
|
|
WANT TO LEARN MORE INFORMATION?
CHECK OUT OUR COURSE